Market Recap
Interest rates fell sharply durin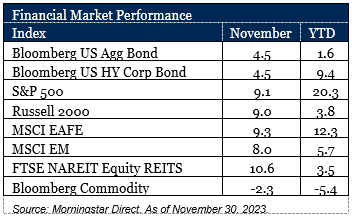 g the month driven by moderating inflation data and a subsequent shift in the Federal Reserve’s tone towards a less hawkish stance. Global markets saw a rally with investors anticipating monetary easing. Although the U.S. yield curve exhibited a “bull flattening” trend (with the long end falling more than the short end), it remains inverted.
Bond prices surged as rates fell across the curve and the Bloomberg U.S. Aggregate Bond Index recorded its best monthly return in 30 years. Expectations of a rate hike pause and moderating inflation alleviated pressure on rates. Notably, November marked the first month since May of this year that fixed income markets broke a streak of monthly declines. Across various fixed income sectors, returns outpaced Treasuries on a duration-adjusted basis, propelled by tightening credit spreads and an increased risk appetite amid favorable fundamentals. This trend is evident in the year-to-date returns of U.S. High Yield Corporate Bonds, which have surpassed other segments within the fixed income markets.
Global equity markets experienced a notable rebound in November. In addition to the Federal Reserve’s shift in tone and the positive economic data trends mentioned earlier, robust earnings growth in the third quarter played a crucial role in driving market momentum and revitalizing investor interest. The S&P 500 Index posted a substantial return of 9.1% for the month. The “Magnificent Seven,” comprising major technology giants Amazon, Apple, Alphabet, Meta, Microsoft, NVIDIA, and Tesla, demonstrated strong performance during the month, with all members except Alphabet (+6.9%) and Meta (+8.6%) outperforming the S&P 500 index. However, all constituents of the Magnificent Seven have delivered eye-popping returns year-to-date, ranging from +46 to +220%. Despite lagging year-to-date, small cap rose as investors continued to assess the probability of a soft landing and a Fed pause.
International markets mirrored the positive sentiment, aligning with domestic markets for the month, buoyed by U.S. Dollar weakness. China continues to weigh on emerging markets, which lagged developed markets in the month despite posting a positive absolute return. Deflationary concerns, weakness in the real estate market, an underwhelming reopening from COVID-19 restrictions, and subpar economic activity have contributed to poor sentiment for the country.
Real Estate Investment Trusts (REITs) experienced a rally in the month, aligning with the positive performance of equity counterparts and managing to enter positive territory year-to-date, despite challenges in the commercial real estate sector. The overall strength was bolstered by a declining interest rate environment, with data centers standing out as top performers, driven by a positive outlook for Artificial Intelligence (AI).
Commodities were the only asset class to struggle during the month, driven primarily by a declining energy sector. The decline in oil prices played a significant role in weakening returns, as concerns grew regarding a potential slowdown in global demand for the commodity. However, at the end of November, OPEC+ announced upcoming production cuts slated for 2024 to support prices, providing a potential positive turn for the sector.
Are You Prepared for the Final Descent?
One of the most notable moves for the month was the velocity at which rates moved lower, driven by recent data that has led to speculation that the Federal Reserve might implement rate cuts under various scenarios.
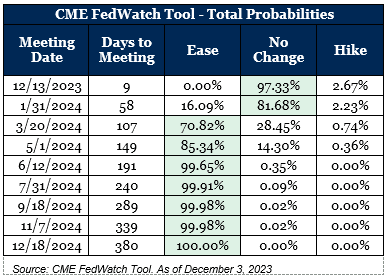 After peaking in October, the 10-year US Treasury (“the 10-year”) fell 54 basis points throughout November, starting at 4.90% and concluding at 4.36%. This marks the largest monthly rate move in 2023, and the largest monthly decrease since 2011. Remarkably, twenty months into the Federal Reserve’s campaign against inflation, investor sentiment has shifted to believe that there is a considerably higher likelihood of the central bank cutting rates in the next four months than raising them in the foreseeable future. The market has resoundingly agreed on 2024 rate cuts.
Below is a hypothetical illustration of the potential consequences – and more acutely theoretical financial impact – of not staying invested.
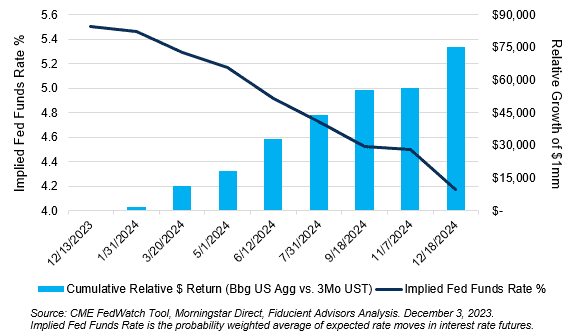
Our analysis shows that there is a significant opportunity cost to holding cash over bonds should the market’s expectations be realized. Based on the implied rates from the futures market, the market is pricing in a decline of up to 133 basis points by end of 2024. Should this occur, bond math would suggest that the Bloomberg U.S. Aggregate Bond Index would return 13.3% vs. 5.7% for 3-Month Treasury Bills. To put this into perspective, if an investor had $1 million in excess cash rather than bonds, they would bear an opportunity cost of roughly $75,000 in forgone gains. This illustration underscores the significant consequences of remaining on the sidelines rather than actively participating in the bond market.