What Happens in March Stays in March
Markets rebound in April as investors move past initial panic reaction to COVID-19
Key Observations
- Investors benefitted from a substantial market rebound in April after an incredibly weak March, but year-to-date returns broadly remain negative with the exception of fixed income.
- Oil lagged the risk-on rally amid a worsening supply/demand imbalance and traded with a negative price for the first time ever.
- While general performance in financial markets was positive in April, lagged economic data is starting to reflect the negative economic impacts of COVID-19, and those grim headlines are likely to persist.
Market Recap
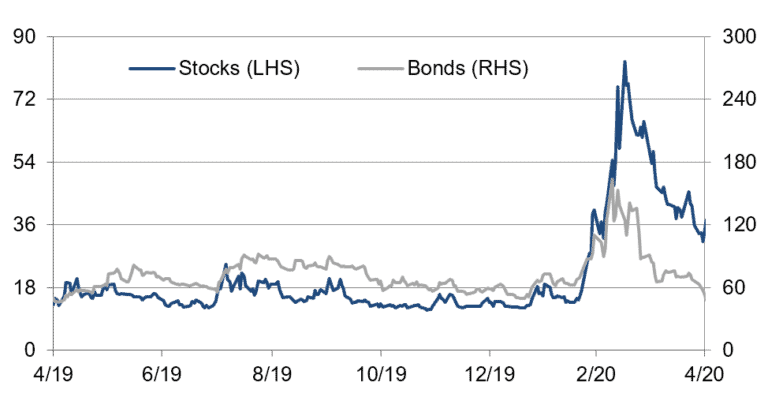
After an incredibly volatile and severe drawdown in March, most markets rebounded in April and recovered some first quarter losses. It was certainly a welcome reprieve for investors as volatility fell, supporting liquidity and allowing for more normal trading activity. The CBOE Volatility Index (VIX), which measures the implied volatility in the U.S. equity market, dropped to an average of 41.5 in April and closed at 34.2, implying +/ – 2.2 percent daily moves in the S&P 500. For comparison purposes, in March, the VIX averaged 53.5, which translates to +/- 3.4 percent daily moves.
In terms of performance, most asset classes generated positive returns in April as the bid for risk assets came back. Within fixed income, U.S. interest rates across the curve were range bound and ended the month flat, while credit spreads tightened globally, most notably in riskier segments of the market. Core U.S. bonds gained 1.8 percent over the month for a year-to-date return of 5 percent. U.S. High Yield returned 4.5 percent in April but remains in negative territory for the year, down 8.8 percent since January.
Equity markets experienced the strongest recovery in April, particularly U.S. companies with large and small cap indices up around 13 percent. Small caps took a severe hit in March and year-to-date returns remain deep in negative territory at -21.1 percent. Performance in real assets and alternatives was mixed, but the outlier was midstream energy, which generated an astounding 49.6 percent over the course of the month. It’s important to note that this return follows a very sharp first quarter drawdown of -57.2 percent, so the index remains 35.9 percent below its value at the start of the year.
It’s difficult to pinpoint one catalyst for the broad market rally, however, there were several key developments and themes that likely contributed to the risk-on sentiment. First off, it seems that as more time passes, the amount of uncertainty in terms of the potential health impact of the virus is waning, albeit at a slow pace. As countries and regions across the world begin to reopen and discussions about that process advance, those headlines and positive news flow likely spur some investor optimism. Another crucial factor at play is the unprecedented stimulus that we’ve seen to date at a global level, on both the monetary and fiscal fronts. From a fiscal standpoint, governments provided tremendous amounts of financial support to individuals, small business and other organizations most severely hit by the shelter-in-place order. On the monetary side, central banks cut interest rates and continue to ramp up asset purchase programs, which are expected to continue for the foreseeable future. In its most recent meeting, the Federal Reserve (Fed) held rates unchanged but reiterated the commitment to support markets until significant progress is made with the economic recovery. The European Central Bank (ECB) assumed a similar stance – current policy rates remain at the same low levels, but leaders stand ready to act as needed.
Implied Volatility Measures Decline from Peaks in Late April
Stock and bond volatility expectations fell but remain above longer-term averages

Stock volatility represented by Chicago Board of Exchange VIX Index
Bond volatility represented by BofA Merrill Lynch MOVE Index
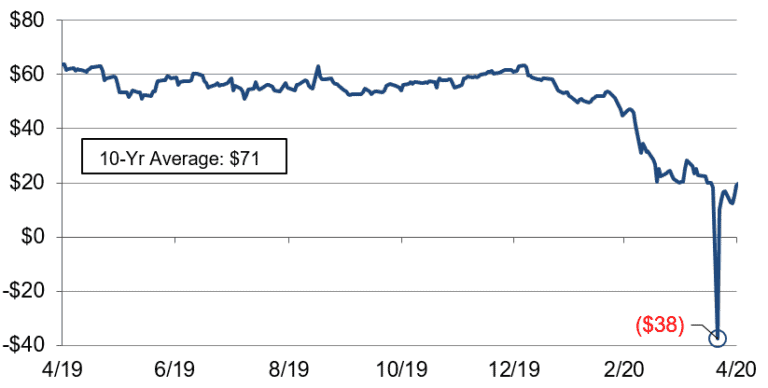
Oil Trades with a Negative Price
While the risk-on tone emerged in most markets, the oil market was one that did not participate in the rally and had a very challenging and volatile April. At the beginning of March, Russia and Saudi Arabia were engaged in a standoff over oil prices, resulting in both countries increasing production at a time when demand was waning and financial markets broadly were under pressure. In early April, the major players reached an agreement to cut production in the face of a severe drop in demand, but supply still overwhelmingly outpaced demand amid the virus outbreak. The supply/demand imbalance further exacerbated the pressure on oil markets, driving prices into negative territory for the first time in history.
While this is unprecedented, it’s conceptually straightforward. Oil is traded via futures contracts, and to put it simply, given the amount of excess supply, holders of those futures contracts didn’t need or weren’t able to receive delivery of the oil at expiration. As such, holders were willing to pay someone else to own the contract and take delivery of the oil. The price of oil has since rebounded into positive territory, but we expect more volatility and price pressure in the near future.
Despite Modest Production Cuts, Oil Prices Tank on Demand Shock
Oil futures contracts reached an all-time low of -$38 on April 20

Source: Bloomberg
Economic Conditions
While most financial markets enjoyed a solid rebound in April, it’s important to note that now is when we should be prepared for economic headlines to become increasingly negative. Economic data, which is typically released on a lag, has already shown signs of deterioration in labor markets and business activity. On the jobs front, over 30 million Americans have filed for unemployment benefits in the last six weeks. Businesses are struggling too with over half of the S&P 500 companies already reporting first quarter earnings through April that show average profit declines of -14 percent. Analyst expectations for second quarter and third quarter earnings are even worse at -37 percent and -15 percent, respectively. At the macro level, the first estimate of first quarter GDP showed a 4.8 percent decline – the biggest drop since the financial crisis. For context, GDP plummeted 8.4 percent in the fourth quarter of 2008. These dismal economic prints are likely to continue in the coming weeks and months, but the key question is how and when the recovery starts to develop, which is largely predicated on our ability to control the virus.
Market Outlook
Since the end of the Global Financial Crisis, broadly speaking, volatility across assets classes had been relatively benign with the exception of a few short bouts. In periods like that, it can be challenging for active managers to find opportunities and generate meaningful alpha relative to passively managed indices. As the saying goes, a rising tide lifts all boats. We find ourselves in a different position today amid the COVID-19 pandemic, which has already created significant amounts of volatility in financial assets and will likely have economic implications for years to come. It’s in markets like these that we at MPS LORIA expect our favored active managers to be dynamic and deliberate in their investment approach to consistently drive strong positive risk-adjusted performance for clients.
From an asset allocation perspective, we continue to refresh and evaluate our capital market assumptions and assess the implications for our client’s portfolios. In the absence of any changes in objectives or cash needs, we advocate for maintaining the established strategic asset allocation that’s rooted in fundamentals. Timing markets correctly is very challenging, especially in today’s environment. We encourage investors to keep their investment horizon in focus and not allow emotions to influence portfolio positioning.
For more information, please contact any of the professionals at MPS LORIA Financial Planners, LLC.
