Market Recap
July brought a mix of resilience and recalibration across global markets. Investors navigated a landscape shaped by ever fluent trade policy, ongoing geopolitical tensions, and a resilient macro backdrop. Equity markets, for the most part, moved higher, buoyed by a strong start to earnings season and better than expected economic data. Additional clarity on trade policy helped as well, as deals were made with key partners such as the U.K., European Union and Japan before the August 1 deadline.
U.S. GDP grew at 3.0 percent in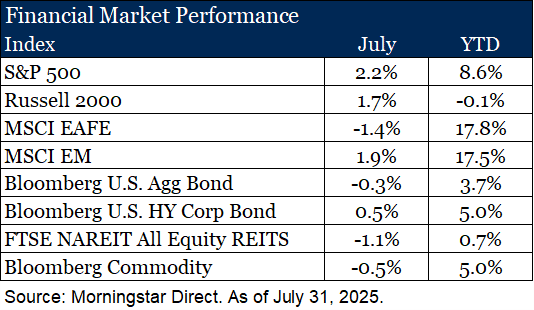 the second quarter,[1] driven primarily by consumer spending and a reduction in imports, and the labor market had continued to be resilient until the last week of the month (more on that below). The S&P 500 Index reached new highs, rising 2.2 percent to start the second half of the year. Technology and energy sectors were standouts, with the former gaining over 5.0 percent as AI-driven optimism persisted and the latter benefiting from rising oil prices amidst continued tensions in the Middle East. Small cap equities (Russell 2000 Index) modestly lagged their large-cap counterparts, gaining 1.7 percent in the month.
Abroad, developed markets, as measured by the MSCI EAFE Index, slipped 1.4 percent. Weakness in European markets, particularly Germany and Switzerland, offset modest gains in the UK and Italy. Currency effects weighed on returns, as the U.S. dollar strengthened modestly against major peers. Despite the modest pullback, international equities remain well ahead of domestic year to date. Emerging markets rose 1.9 percent in July. China was the standout, gaining almost 5 percent, driven by policy support and improving sentiment around regulation. Broader EM strength was also supported by gains in Korea, though India declined amid ongoing trade uncertainty and an increase in threatened tariffs.
Fixed income markets were mixed as the Bloomberg U.S. Aggregate Bond Index slipped 0.3 percent in July as investors digested mixed signals from the Federal Reserve. The FOMC held rates steady in July amid persistent inflation and uneven market data. It was not a unanimous decision as there were two dissenting votes, the first time since 1993. Rates moved higher over the course of the month, driven by lingering inflation concerns, deficit expansion and the markets reduced outlook for recession in the near term. High yield bonds fared better, buoyed by a strong earnings season, a favorable economic backdrop and continued investor appetite for yield. The asset class has now returned approximately 5 percent year-to-date.
REITs struggled in July. Positive sentiment on the economy was not enough to offset weakness in self-storage, residential and office. Rising rates and a reduced outlook for Fed cuts was a headwind for the asset class. Commodities were mixed but ultimately ended the month lower. Concerns about trade policy negatively impacted industrial metals, with copper prices plummeting 25 percent in the last week of the month. Energy prices were modestly firmer amidst geopolitical tensions around the world.
[1] Bureau of Economic Analysis. Advance estimate for Q2 2025 GDP. As of July 30, 2025.
Strong Earnings, High Expectations
The second quarter earnings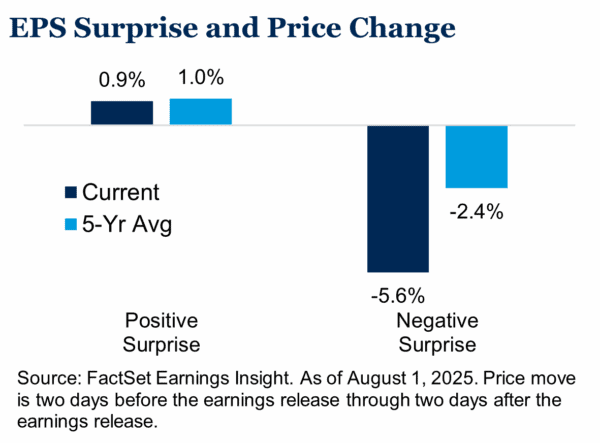 season continues to deliver upside surprises, with broad-based growth and strong beat rates. However, stretched valuations, shifting economic data, and a disproportionate penalty for companies that have missed estimates may suggest we are entering into a more discerning phase. As of August 1, 66 percent of S&P 500 companies have reported results for the second quarter. Despite the mixed macro backdrop, 82 percent of have reported a positive earnings surprise and the blended year-over-year growth rate is currently 10.3 percent.[1] Information technology, communications, and consumer discretionary continue to be a standout among sectors, driven by some of the some of the “Magnificent 7” names, while energy was a laggard on the back of falling year-over-year oil prices. Market reaction has been sharp. Companies beating EPS estimates are seeing an average price increase of 0.9 percent in the two days around the announcement, roughly in-line with the 5-year average. Misses have been punished more severely, with an average decline of 5.6 percent, worse than recent past, and a prime example of the fragility that persists in markets today.
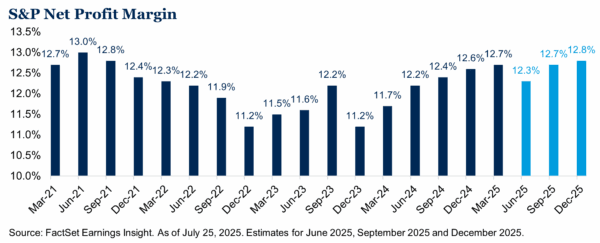
Tariff related concerns and the potential impact on higher cost of goods and inflation have investors wondering about the impact on company fundamentals. While it is still early to feel the full impact of trade policy, there may be room for companies to absorb some of the added cost pressures. Margins remain healthy. The net profit margin for the S&P 500 is 12.3 percent, slightly down versus the prior quarter but above the 5-year average[2]. Margin expansion is evident in sectors such as communication services, information technology and financials, while energy and real estate margins have contracted.
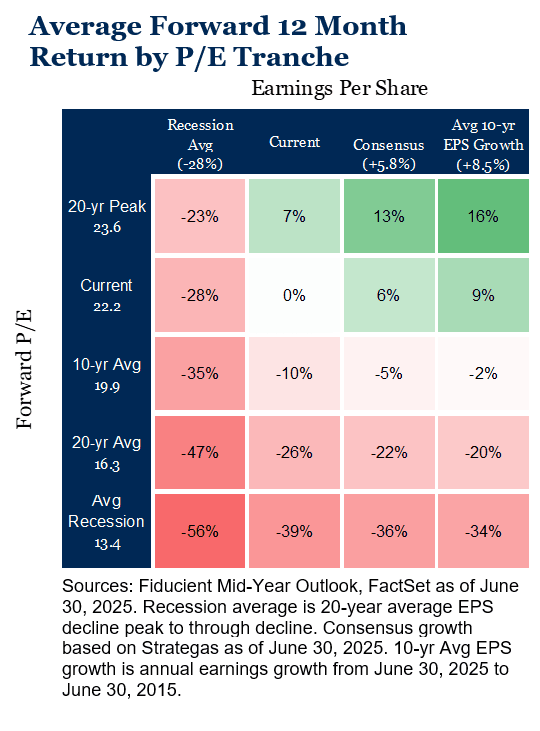 Fundamentals remain favorable yet valuations remain elevated. The forward 12-month P/E ratio for the S&P 500 hovers near 22 times earnings, well above long-term averages. This premium reflects optimism but raises the bar for earnings to continue delivering. So far, the second quarter earnings results are broadly encouraging. Companies are managing costs well and delivering solid earnings growth. However, investors appear more selective, with clear sector divergences and heightened sensitivity to misses. With valuations rich and expectations high, upcoming quarters will require consistent delivery to sustain current market levels. As we highlighted in our Mid-Year Outlook, markets remain fragile and should investor confidence or earnings weaken, the path forward for U.S. equities becomes more uncertain.
[1] FactSet Earnings Insight. As of August 1, 2025.
[2] FactSet Earnings Insight. As of July 25, 2025.
July Employment Report Creates More Uncertainty
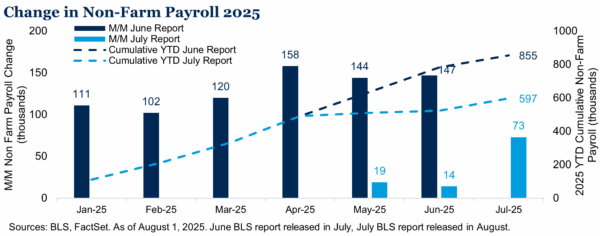
There was no shortage of economic data released during the month but perhaps the most significant was the July employment report, which technically did not have market implications for the month of July as the report was released on August 1. That said, it is worth highlighting nonetheless as there was a considerable shift in the data from a month earlier. The labor market, for the most part, had been on relatively stable footing for much of the last 12 months, hovering between 4.0-4.2 percent unemployment with steady monthly gains. However, July brought a different perspective with only 73,000 new jobs added in the month, well below the consensus estimate of 115,000[1]. While the miss is concerning, the largest takeaway from the report was the significant revision for May and June, reducing the combined number of jobs by 258,000(!) from what was originally released.
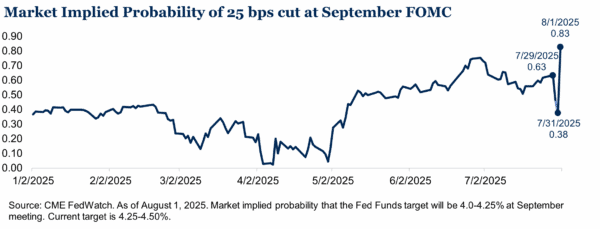
Up until recently, hard economic data had been resilient in the face of the Trump administration’s tariffs, but the revised data certainly begs the question, are we starting to see the impact already? Further, the recent jobs report fueled the volatility of market expectations for when the Federal Reserve would cut rates. Expectations had been above 50 percent heading into the FOMC’s July meeting, but following Powell’s press conference, which markets took to be “hawkish”, the probability dropped to below 40 percent. The roller coaster didn’t stop and following the recent employment report, expectations for a 25 basis point cut in September jumped to over 80 percent. The Fed has held steadfast in its “data dependent” approach and there is one additional employment report to digest before the next Fed meeting in September, but the July employment release will be impossible to ignore as the Committee balances its dual mandate of stable inflation and full employment.
[1] BLS, FactSet. As of August 1, 2025.